# Third-party imports import pandas as pd # For data processing, CSV file I/O import numpy as np # For numerical operations and mathematical functions import matplotlib.pyplot as plt # For data visualization import seaborn as sns # For statistical graphics import plotly.express as px # For interactive plotting from sklearn.model_selection import train_test_split # For data splitting for machine learning from sklearn.preprocessing import MinMaxScaler, StandardScaler # For feature standardization from sklearn.metrics import accuracy_score # For model evaluation from termcolor import colored # For colored text printing from sklearn.ensemble import RandomForestClassifier # For random forest classifier model
# For warning handling warnings.filterwarnings('ignore') # For ignoring warnings
# Read the CSV file and save it in "data" variable data= pd.read_csv(filePath,sep=';')
# Check loading data print(colored("THE DATASET LOADED SUCCESSFULLY...", "green", attrs=['reverse']))
except FileNotFoundError: print(colored("ERROR: File not found!", "red", attrs=['reverse']))
except Exception as e: print(colored(f"ERROR: {e}", "red", attrs=['reverse']))
4.2 数据探索
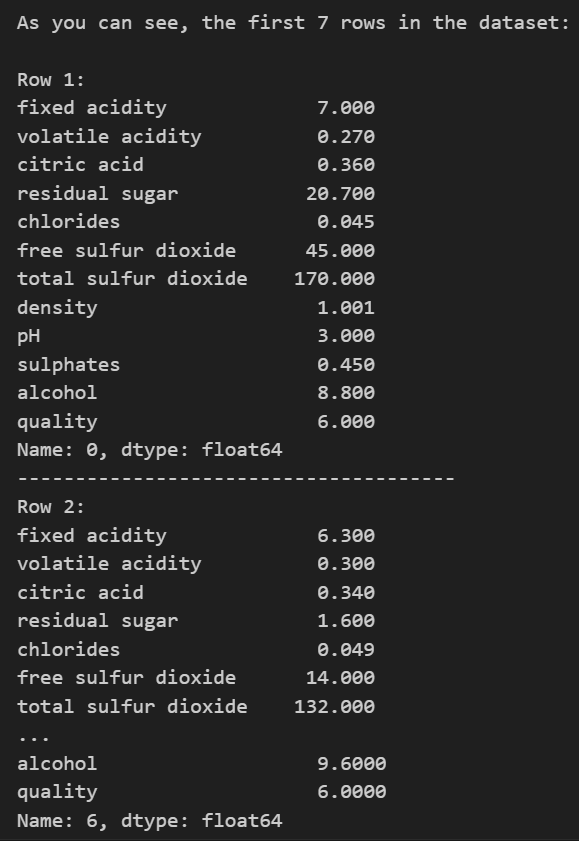
在进行任何预处理之前,我们应该对数据有一个基本的了解,首先查看数据前几行。
# 查看数据集的前几行
dataset_rows = data.head(7) #.head() the default value = 5

print(colored('As you can see, the first 7 rows in the dataset:\n', 'green', attrs=['reverse']))

# Iterate over each row in the dataset_rows DataFrame
for index, row in dataset_rows.iterrows():
    # Print the index label of the current row
    print(colored(f"Row {index + 1}:","white",attrs=['reverse']))

    # Print the content of the current row
    print(row)

    # Print a separator line
    print("--------------------------------------")
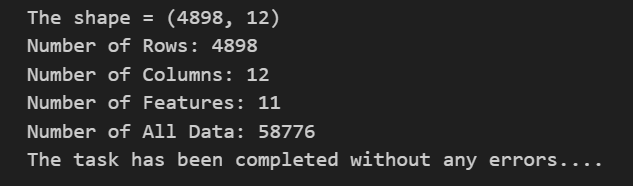
查看数据的基本情况,包括shape、特征、总数等等。
print("The shape =",data.shape)

# Show information about the dataset
num_rows, num_cols = data.shape
num_features = num_cols - 1
num_data = num_rows * num_cols

# Print the information
print(f"Number of Rows: {num_rows}")
print(f"Number of Columns: {num_cols}")
print(f"Number of Features: {num_features}")
print(f"Number of All Data: {num_data}")

# Check and ensure running
print(colored("The task has been completed without any errors....","green", attrs=['reverse']))
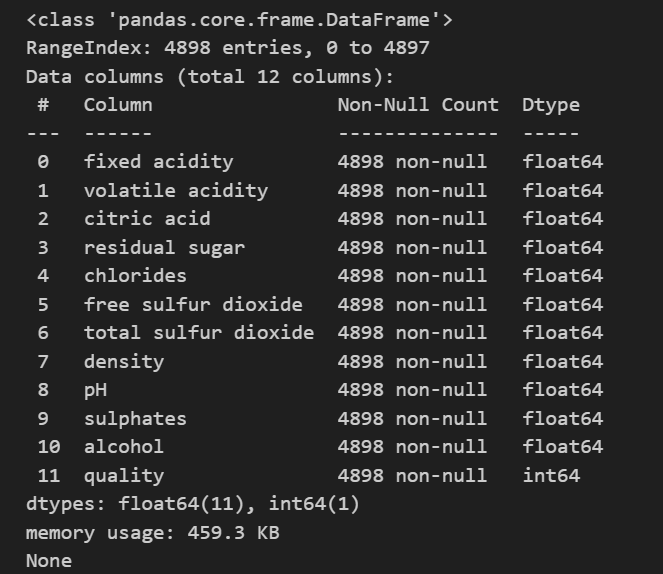
# 查看数据集的信息
print(data.info())
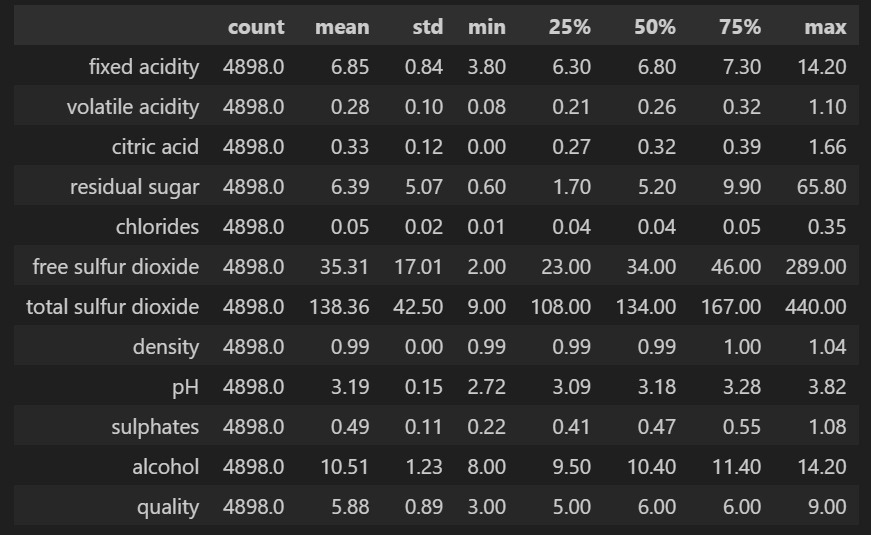
查看数据统计特征。
data.describe().T.round(2)
查看数据标签的分布情况。
# Create a count plot using seaborn sns.catplot(data=data, x='quality', kind='count')
# Add labels and title to the plot plt.title('Distribution of Wine Quality') plt.xlabel('Quality') plt.ylabel('Count')
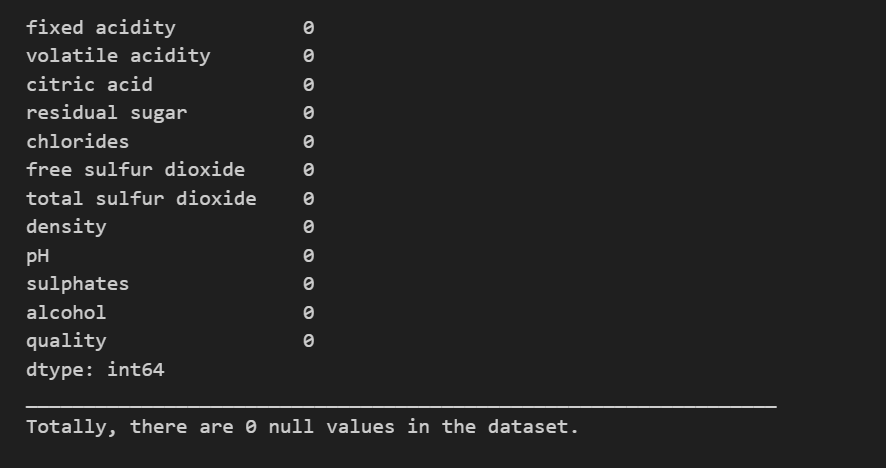
# Check for missing values
null_counts = data.isnull().sum()

# Display the number of null values
print(null_counts)

print("_________________________________________________________________")
print(colored(f"Totally, there are {null_counts.sum()} null values in the dataset.","green", attrs=['reverse']))
发现数据集中无缺失值的存在(万恶的资本主义数据集中都没有空值)。
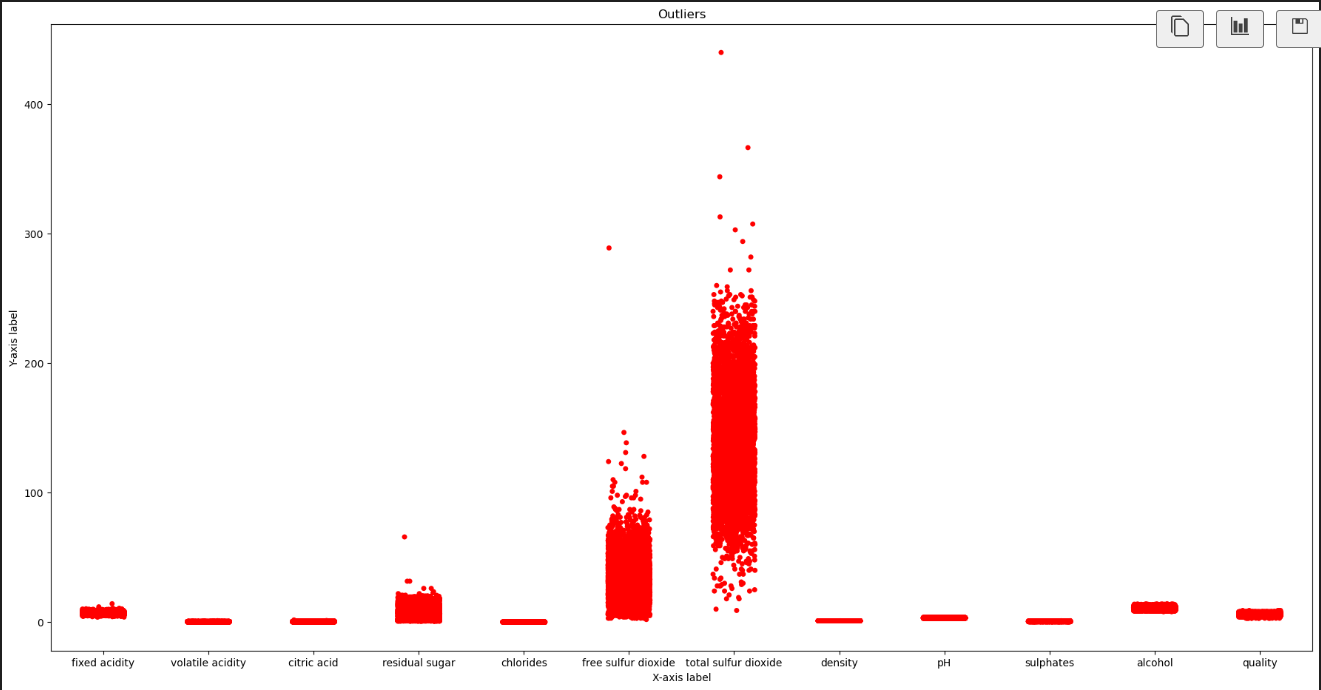
4.3.2 异常值处理
# Set the figure size
plt.figure(figsize=(22, 11))

# Add outliers to the plot
sns.stripplot(data=data, color="red", jitter=0.2, size=5)

# Set the axis labels and title
plt.title("Outliers")
plt.xlabel("X-axis label")
plt.ylabel("Y-axis label")

# Show the plot
plt.show()
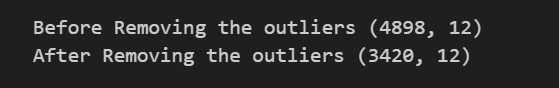
# Delete the outliers
# The data before deleting outliers
print("Before Removing the outliers", data.shape)

# Deleting outliers (Removing the number of observation where the total sulfur dioxide is more than 160)
data = data[data['total sulfur dioxide']<160]

#The data after deleting outliers
print("After Removing the outliers", data.shape)
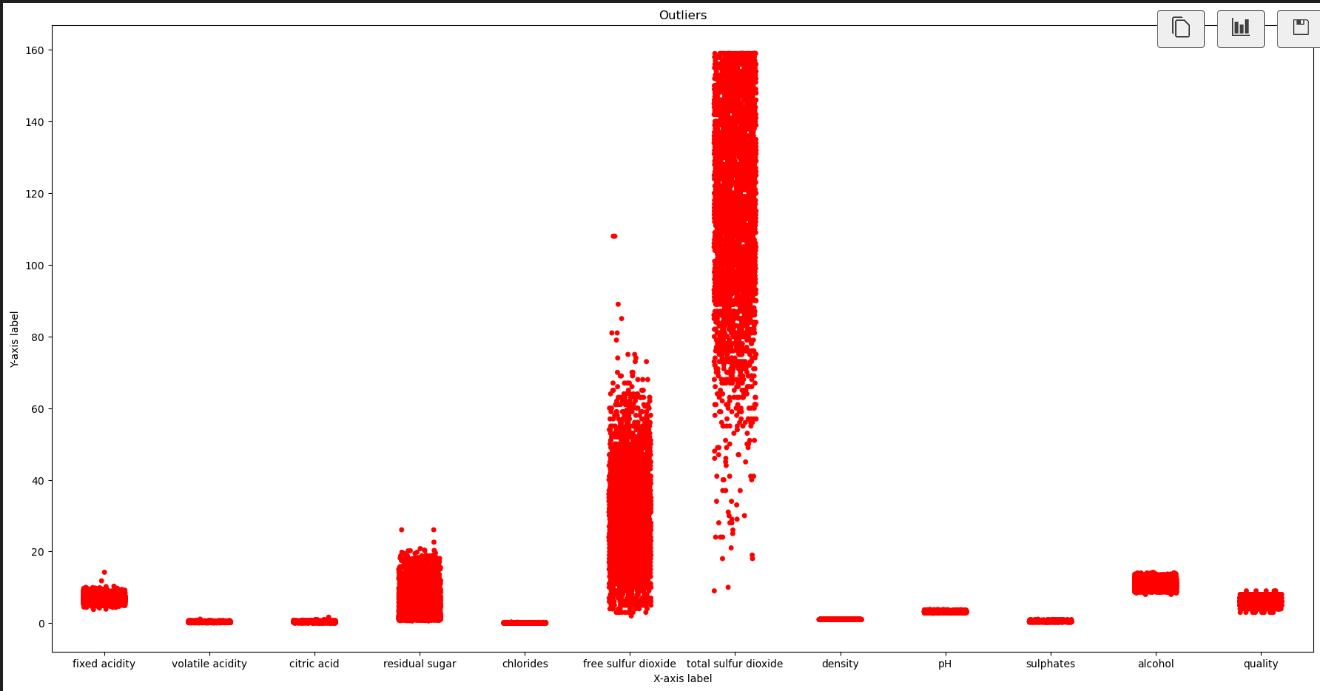
# Set the figure size
plt.figure(figsize=(22, 11))

# Add outliers to the plot
sns.stripplot(data=data, color="red", jitter=0.2, size=5)

# Set the axis labels and title
plt.title("Outliers")
plt.xlabel("X-axis label")
plt.ylabel("Y-axis label")

# Show the plot
plt.show()
五、模型训练
5.1 数据标签的0/1化
# Split the data into features (X) and target variable (Y) X = data.drop('quality',axis=1)
# Create a new series 'Y' by applying a lambda function to the 'quality' column of the 'data' DataFrame # The lambda function assigns a value of 1 if the 'quality' value is greater than or equal to 5, otherwise assigns 0 Y = data['quality'].apply(lambda y_value: 1if y_value >= 5else0)
# Print the shapes of X and Y to verify the splitting print("Shape of X:", X.shape) print("Shape of Y:", Y.shape)
5.2 数据的归一化
# Rescale and normalize the features
'''
# Standardization (Normalization)
standard_scaler = StandardScaler()
X = standard_scaler.fit_transform(X)
'''

# Min-Max Scaling (Rescaling)
min_max_scaler = MinMaxScaler()
X = min_max_scaler.fit_transform(X)

#I will choose one of them in the future part "model selection" based on the highest accuracy
5.3 划分数据集
我们将数据集划分为训练集和测试集。
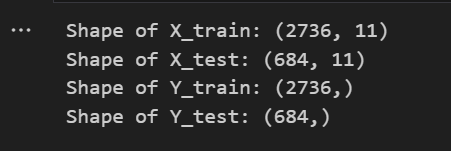
X_train, X_test, Y_train, Y_test = train_test_split(X, Y, test_size=0.2, random_state=44)

# Print the shapes of the training and testing sets to verify the splitting
print("Shape of X_train:", X_train.shape)
print("Shape of X_test:", X_test.shape)
print("Shape of Y_train:", Y_train.shape)
print("Shape of Y_test:", Y_test.shape)
5.4 训练模型
使用RandomForestClassifier训练模型。
# Initialize lists to store training and testing accuracies scoreListRF_Train = [] scoreListRF_Test = []
# Iterate over different values of max_depth for max_dep in range(1, 5): # Iterate over different values of random_state for rand_state in range(1, 20): # Iterate over different values of n_estimators for n_est in range(1, 15): # Create a Random Forest model with the different values of max_depth, random_state, and n_estimators Model = RandomForestClassifier(n_estimators=n_est, random_state=rand_state, max_depth=max_dep)
# Fit the model on the training data Model.fit(X_train, Y_train)
# Calculate and store the training accuracy scoreListRF_Train.append(Model.score(X_train, Y_train))
# Calculate and store the testing accuracy scoreListRF_Test.append(Model.score(X_test, Y_test))
# Find the maximum accuracy for both training and testing RF_Accuracy_Train = max(scoreListRF_Train) RF_Accuracy_Test = max(scoreListRF_Test)
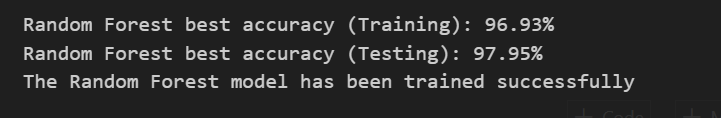
# Print the best accuracies achieved print(f"Random Forest best accuracy (Training): {RF_Accuracy_Train*100:.2f}%") print(f"Random Forest best accuracy (Testing): {RF_Accuracy_Test*100:.2f}%")
# Print a success message indicating that the model has been trained successfully print(colored("The Random Forest model has been trained successfully","green", attrs=['reverse']))
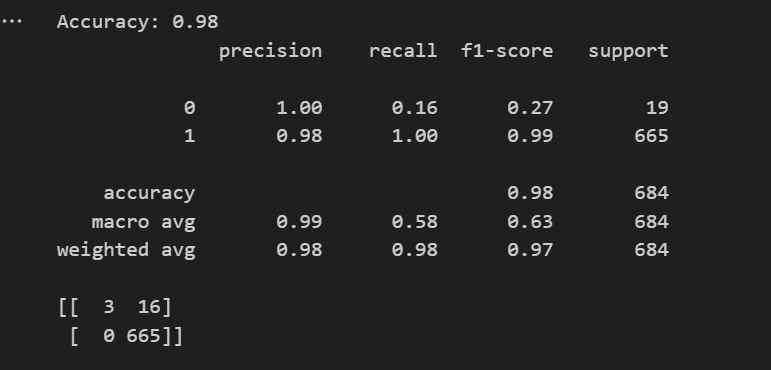
5.5 模型评估
评估模型的性能。
from sklearn.metrics import accuracy_score, classification_report, confusion_matrix